100
%
MapQTL ® 7
MapQTL ® 7
Neogen Informatics is an authorised and preferred reseller of Kyazma's JoinMap and MapQTL in India.
MapQTL is a computer program for genetic analysis of segregating quantitative traits in experimental populations of diploid species. The analysis tries to detect regions in the genome that are responsible for phenotypic variation in the investigated quantitative trait. These regions are called quantitative trait loci (QTL). At the same time the genotypic effects associated with the segregating QTL alleles are estimated. The software can deal with all common types of experimental population, including the full-sib family (F1) of a cross between two individuals of an outbreeding species. The available methods are interval mapping, the powerful MQM mapping (equivalent to composite interval mapping) and the nonparametric Kruskal-Wallis test. The permutation test and automatic cofactor selection are supporting methods that can be applied. The so-called traits scan method performs a condensed analysis of large numbers of quantitative traits based on interval mapping. Finally, it is possible to investigate the presence of epistasis between two loci. MapQTL is an easy-to-use MS-Windows program with an intuitive user interface.
Salient features:
 many experimental population types:
- BC1 - first generation backcross;
- F2;
- RIx - recombinant inbred lines family;
- DH1, DH - family of F1-derived doubled haploids;
- DH2 - family of F2-derived doubled haploids;
- HAP1, HAP - family of haploids;
- BCpxFy - advanced backcross inbred lines family;
- IMxFy - advanced intermated inbred lines family;
- CP - outbreeder full-sib family;
- Input in plain text files with a flexible layout of the quantitative trait data, the molecular marker genotypes and the (precalculated) linkage map; map and molecular marker data files are compatible with JoinMap; quantitative traits can also be copied from a spreadsheet.
- Interval mapping.
- MQM mapping, in which markers are used as cofactors to absorb the effects of nearby QTLs, thereby increasing the power for mapping other segregating QTLs; it may even enable the separation and mapping of linked QTLs.
- Automatic selection of cofactors using a backwards elimination procedure to easily get the set of cofactors for MQM mapping.
- Permutation test to determine the significance level of interval mapping without the usual assumption of normality of the data residuals.
- Nonparametric mapping with the Kruskal-Wallis rank sum test per marker to assess the segregation of QTLs for non-normally distributed data.
- Epistasis test.
- The Haley & Knott regression approximation to maximum likelihood interval and MQM mapping is available;
- simple experimental design (e.g. blocking) and covariates can be analysed jointly with interval and MQM mapping.
- Multiple populations and maps in a single project.
- Traits observed in multiple populations can be analysed combined over the populations with interval and MQM mapping based on a common (integrated) linkage map.
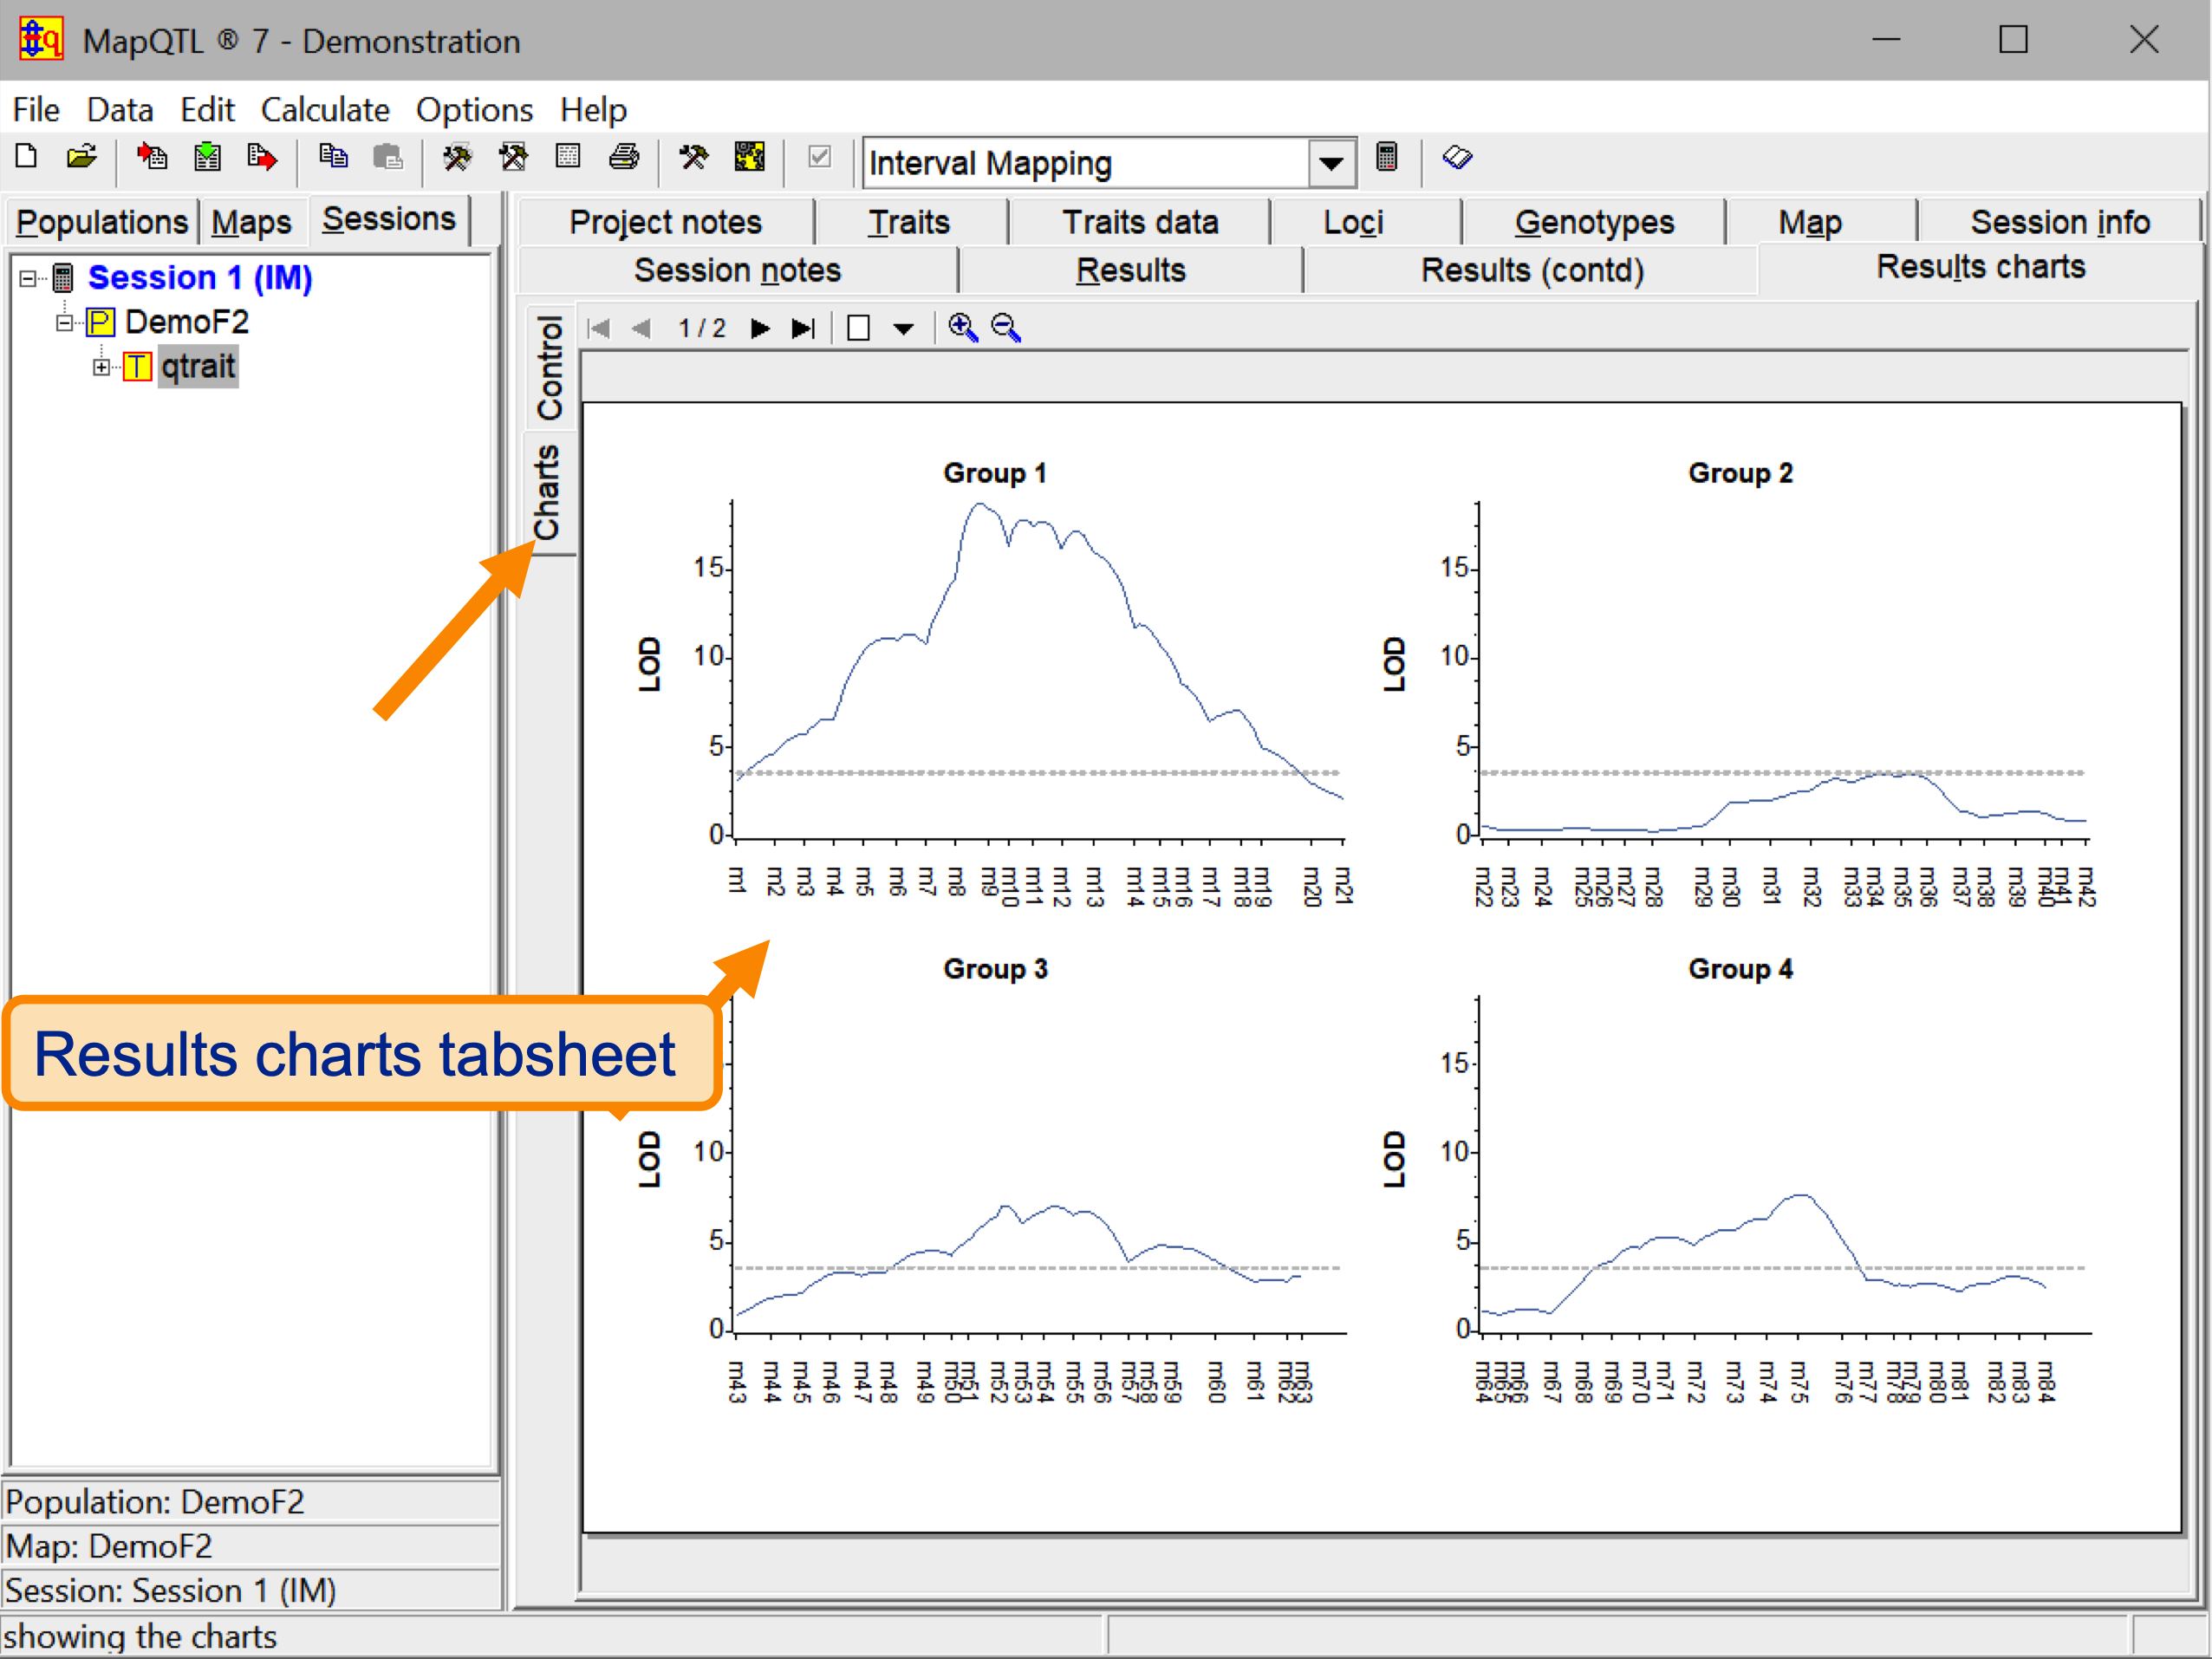
- QTL charts with many adjustable features.
- Results and charts exportable to most MS-Windows text processing, presentation and spreadsheet software.
For more details: kyazma.nl